


Tiếng Anh 12 Unit 4 Writing
1. Work in pairs. Look at the line graph. Match the sentences with the information in the graph. 2. Look at the line graph and put the paragraphs in the correct order. 3. The line graph below illustrates population trends in Viet Nam from 1960 to 2020. Write a description (120-150 words) of the graph. Use the expressions in 1, the model and tips in 2, and the suggestions below to help you.
Bài 1
Video hướng dẫn giải
Description of a line graph (Miêu tả biểu đồ đường)
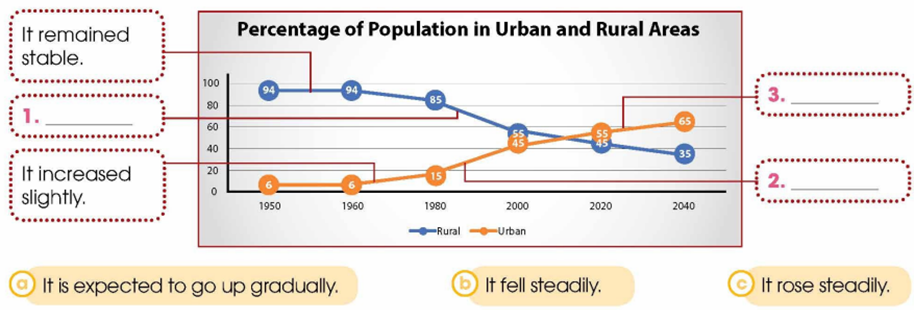
1. Work in pairs. Look at the line graph. Match the sentences with the information in the graph.
(Làm việc theo cặp. Nhìn vào biểu đồ đường. Nối các câu với thông tin trong biểu đồ.)
Phương pháp giải:
- Percentage of Population in Urban and Rural Areas: Phần trăm dân số ở các vùng nông thôn và thành thị
- It remained stable: Nó vẫn ổn định
- It increased slightly: Nó tăng nhẹ
Lời giải chi tiết:
|
1. b |
2. a |
3. c |
1 - b. It fell steadily.
(Nó giảm đều.)
2 - a. It is expected to go up gradually.
(Dự kiến nó sẽ tăng dần.)
3 - c. It rose steadily.
(Nó tăng đều.)
Bài 2
Video hướng dẫn giải
2. Look at the line graph and put the paragraphs in the correct order.
(Nhìn vào biểu đồ đường và đặt các đoạn văn theo thứ tự đúng.)
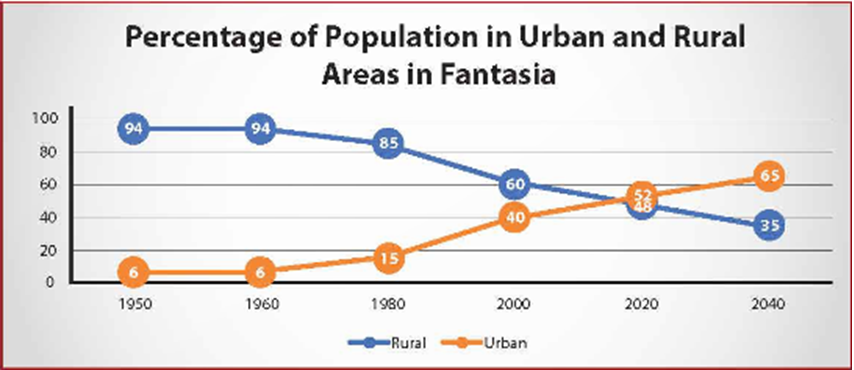
A. By contrast, the urban population rose throughout the same period. In 1950, the percentage of urban population was just around 6 per cent. It increased slightly to 15 per cent in 1980. After that, the figure rose steadily and in 2000 it stood at 40 per cent. The upward trend continued and in 2020, more than half of its population lived in urban areas. In the next twenty years, the urban population is expected to reach 65 per cent of the total population.
B. The line graph shows population trends in Fantasia's urban and rural areas over the 1950-2040 period. Overall, the urban population has increased and will continue to grow while the rural population has decreased and will continue to fall.
C. In 1950, 94 per cent or most of Fantasia's population lived in rural areas. This figure remained stable until 1960. However, from 1960 to 1980, the percentage of rural population fell slightly to 85 per cent. This figure went down steadily to 48 per cent in 2020 and is expected to drop to 35 per cent in 2040.
Phương pháp giải:
|
Tips (Mẹo) To describe a line graph, you should: (Để mô tả biểu đồ đường, bạn nên)
(giới thiệu và mô tả đặc điểm nổi bật nhất của biểu đồ đường) Example: The line graph shows information about/changes in/illustrates how/compares ... Overall, ... (Ví dụ: Biểu đồ đường hiển thị thông tin về/những thay đổi trong/minh họa cách/so sánh ... Nhìn chung, ...)
(mô tả xu hướng) Example: (Ví dụ) - The figure/proportion/percentage rose/increased/went up + slightly/slowly/gradually/rapidly. (Con số/tỷ lệ/ tăng + nhẹ/chậm/dần dần/nhanh chóng.) - The figure/proportion/percentage fell/decreased/went down + slightly/slowly/gradually/rapidly. (Con số/ tỷ lệ giảm + nhẹ/chậm/dần dần/nhanh chóng.) - ... fell/rose to/by... (…giảm/ tang đến/ bởi…) - ... remained the same/stable. (…vẫn ổn định.)
(đưa ra sự so sánh.) Example: (Ví dụ) By contrast,... /Compared to ... /In comparison with ... (Ngược lại,... /So với... /So với...) |
Lời giải chi tiết:
B. The line graph shows population trends in Fantasia's urban and rural areas over the 1950-2040 period. Overall, the urban population has increased and will continue to grow while the rural population has decreased and will continue to fall.
C. In 1950, 94 per cent or most of Fantasia's population lived in rural areas. This figure remained stable until 1960. However, from 1960 to 1980, the percentage of rural population fell slightly to 85 per cent. This figure went down steadily to 48 per cent in 2020 and is expected to drop to 35 per cent in 2040.
A. By contrast, the urban population rose throughout the same period. In 1950, the percentage of urban population was just around 6 per cent. It increased slightly to 15 per cent in 1980. After that, the figure rose steadily and in 2000 it stood at 40 per cent. The upward trend continued and in 2020, more than half of its population lived in urban areas. In the next twenty years, the urban population is expected to reach 65 per cent of the total population.
Tạm dịch:
B. Biểu đồ đường thể hiện xu hướng dân số ở khu vực thành thị và nông thôn Fantasia trong giai đoạn 1950-2040. Nhìn chung, dân số thành thị đã tăng và sẽ tiếp tục tăng trong khi dân số nông thôn đã giảm và sẽ tiếp tục giảm.
C. Năm 1950, 94% hay phần lớn dân số Fantasia sống ở khu vực nông thôn. Con số này duy trì ổn định cho đến năm 1960. Tuy nhiên, từ năm 1960 đến năm 1980, tỷ lệ dân số nông thôn giảm nhẹ xuống còn 85%. Con số này giảm dần xuống còn 48% vào năm 2020 và dự kiến sẽ giảm xuống 35% vào năm 2040.
A. Ngược lại, dân số thành thị lại tăng trong cùng thời kỳ. Năm 1950, tỷ lệ dân số thành thị chỉ khoảng 6%. Nó tăng nhẹ lên 15% vào năm 1980. Sau đó, con số này tăng đều đặn và đến năm 2000 đứng ở mức 40%. Xu hướng tăng tiếp tục diễn ra và đến năm 2020, hơn một nửa dân số sống ở khu vực thành thị. Trong 20 năm tới, dân số đô thị dự kiến sẽ đạt 65% tổng dân số.
Bài 3
Video hướng dẫn giải
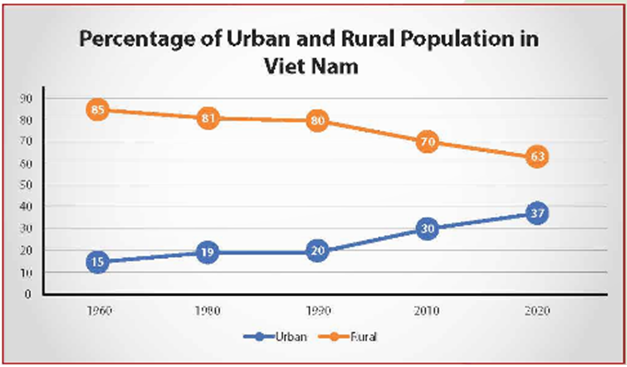
3. The line graph below illustrates population trends in Viet Nam from 1960 to 2020. Write a description (120-150 words) of the graph. Use the expressions in 1, the model and tips in 2, and the suggestions below to help you.
(Biểu đồ dưới đây minh họa xu hướng dân số ở Việt Nam từ năm 1960 đến năm 2020. Viết bài miêu tả (120-150 từ) về biểu đồ. Sử dụng các biểu thức ở phần 1, mô hình và mẹo ở phần 2 và những gợi ý bên dưới để giúp bạn.)
The line graph shows population trends in Viet Nam from 1960 to 2020. Overall, the urban population ...
In 1960, most Vietnamese people...
However, from 1960 to 1980, ... From 1990, ...
By contrast, the urban population rose throughout the same period. In 1960, ...
In 1980,... From 1990, ...
Lời giải chi tiết:
The line graph shows the urban and rural population in Viet Nam from 1960 to 2020. Overall, the urban population increased while the rural population decreased.
In 1960, most Vietnamese people lived in rural areas. However, from 1960 to 1980, the percentage of the rural population fell slightly to 81 per cent. Then the figure remained stable for the next ten years. From 1990 to 2000, the proportion of the population living in rural areas continued to decrease gradually. In 2020, the rural population was only 63 per cent of the total population of Viet Nam.
By contrast, the urban population rose throughout the same period. In 1960, the percentage of the city population was just around 15 per cent. The figure went up slightly in 1980 and remained stable until 1990 when less than 20 per cent of the population lived in urban areas. Since 1990, the proportion of the urban population has increased gradually and in 2020, it reached 37 per cent of the total population.
Tạm dịch:
Biểu đồ đường thể hiện dân số thành thị và nông thôn ở Việt Nam từ năm 1960 đến năm 2020. Nhìn chung, dân số thành thị tăng trong khi dân số nông thôn giảm.
Năm 1960, hầu hết người dân Việt Nam sống ở nông thôn. Tuy nhiên, từ năm 1960 đến năm 1980, tỷ lệ dân số nông thôn giảm nhẹ xuống còn 81%. Sau đó, con số này vẫn ổn định trong mười năm tiếp theo. Từ năm 1990 đến năm 2000, tỷ trọng dân số sống ở nông thôn tiếp tục giảm dần. Năm 2020, dân số nông thôn chỉ chiếm 63% tổng dân số Việt Nam.
Ngược lại, dân số thành thị lại tăng trong cùng thời kỳ. Năm 1960, tỷ lệ dân số thành phố chỉ khoảng 15%. Con số này tăng nhẹ vào năm 1980 và duy trì ổn định cho đến năm 1990 khi chưa đến 20% dân số sống ở khu vực thành thị. Từ năm 1990, tỷ lệ dân số thành thị tăng dần và đến năm 2020 đạt 37% tổng dân số.
The line graph illustrates the percentage of the urban and rural population in Vietnam from 1960 to 2020. The data reveals a clear trend of urbanization over the decades.
In 1960, the rural population accounted for 85% of the total, while the urban population was only 15%. Over the years, the rural population steadily declined, dropping to 81% in 1980, 70% in 2010, and 63% in 2020. Meanwhile, the urban population showed a gradual increase, rising from 15% in 1960 to 19% in 1980, 30% in 2010, and 37% in 2020.
This trend indicates a significant shift from rural to urban living, likely driven by industrialization, economic development, and better opportunities in cities. If this pattern continues, Vietnam’s urban population may continue to rise in the coming years, while the rural population declines further.
Tạm dịch:
Biểu đồ đường này minh họa tỷ lệ dân số thành thị và nông thôn tại Việt Nam từ năm 1960 đến năm 2020. Dữ liệu cho thấy xu hướng đô thị hóa rõ ràng qua nhiều thập kỷ.
Năm 1960, dân số nông thôn chiếm 85% tổng số, trong khi dân số thành thị chỉ chiếm 15%. Trong những năm qua, dân số nông thôn giảm dần, giảm xuống còn 81% vào năm 1980, 70% vào năm 2010 và 63% vào năm 2020. Trong khi đó, dân số thành thị tăng dần, tăng từ 15% vào năm 1960 lên 19% vào năm 1980, 30% vào năm 2010 và 37% vào năm 2020.
Xu hướng này cho thấy sự thay đổi đáng kể từ cuộc sống nông thôn sang thành thị, có thể là do công nghiệp hóa, phát triển kinh tế và cơ hội tốt hơn ở các thành phố. Nếu mô hình này tiếp tục, dân số thành thị của Việt Nam có thể tiếp tục tăng trong những năm tới, trong khi dân số nông thôn tiếp tục giảm.
The line graph shows the percentage of Vietnam’s urban and rural population from 1960 to 2020, highlighting a shift towards urbanization over time.
In 1960, the rural population made up a large majority at 85%, while only 15% of people lived in urban areas. Over the following decades, the rural population gradually declined, falling to 81% in 1980, 70% in 2010, and 63% in 2020. In contrast, the urban population steadily increased, rising from 15% in 1960 to 19% in 1980, 30% in 2010, and reaching 37% in 2020.
These figures suggest a continuous movement of people from rural to urban areas, likely influenced by economic growth, industrialization, and better job opportunities in cities. If this trend continues, Vietnam's urban population may keep expanding while the rural population decreases further in the future.
Tạm dịch:
Biểu đồ đường cho thấy tỷ lệ dân số thành thị và nông thôn của Việt Nam từ năm 1960 đến năm 2020, làm nổi bật sự chuyển dịch theo hướng đô thị hóa theo thời gian.
Năm 1960, dân số nông thôn chiếm đa số với 85%, trong khi chỉ có 15% người dân sống ở khu vực thành thị. Trong những thập kỷ tiếp theo, dân số nông thôn giảm dần, giảm xuống còn 81% vào năm 1980, 70% vào năm 2010 và 63% vào năm 2020. Ngược lại, dân số thành thị tăng đều đặn, tăng từ 15% vào năm 1960 lên 19% vào năm 1980, 30% vào năm 2010 và đạt 37% vào năm 2020.
Những con số này cho thấy sự di chuyển liên tục của người dân từ nông thôn đến thành thị, có thể chịu ảnh hưởng của tăng trưởng kinh tế, công nghiệp hóa và cơ hội việc làm tốt hơn ở các thành phố. Nếu xu hướng này tiếp tục, dân số thành thị của Việt Nam có thể tiếp tục tăng trong khi dân số nông thôn tiếp tục giảm trong tương lai.
The line graph illustrates the trends in urban and rural populations in Vietnam from 1960 to 2020. Overall, the graph shows that the urban population has steadily increased while the rural population has gradually declined over the 60-year period.
In 1960, a significant majority of the Vietnamese population, 85%, lived in rural areas. The rural population slightly decreased to 81% by 1980 and remained relatively stable until 1990. However, from 1990 onwards, the proportion of the rural population gradually declined, reaching 63% in 2020.
On the other hand, the urban population in Vietnam rose during the same period. In 1960, only 15% of the population lived in urban areas. This percentage increased slightly to 19% by 1980 and then remained stable until 1990. From 1990 to 2020, the urban population grew steadily, reaching 37% by the end of the period.
Tạm dịch:
Biểu đồ đường minh họa xu hướng dân số đô thị và nông thôn ở Việt Nam từ năm 1960 đến năm 2020. Nhìn chung, biểu đồ cho thấy dân số đô thị đã tăng đều đặn trong khi dân số nông thôn giảm dần trong suốt 60 năm qua.
Vào năm 1960, phần lớn dân số Việt Nam, 85%, sống ở khu vực nông thôn. Dân số nông thôn giảm nhẹ xuống còn 81% vào năm 1980 và vẫn ổn định cho đến năm 1990. Tuy nhiên, từ năm 1990 trở đi, tỷ lệ dân số sống ở nông thôn giảm dần, chỉ còn 63% vào năm 2020.
Ngược lại, dân số đô thị ở Việt Nam tăng trong cùng giai đoạn này. Năm 1960, chỉ có 15% dân số sống ở khu vực đô thị. Tỷ lệ này tăng nhẹ lên 19% vào năm 1980 và sau đó duy trì ổn định cho đến năm 1990. Từ năm 1990 đến 2020, dân số đô thị tăng đều đặn, đạt 37% vào cuối giai đoạn.
 Bình luận

- Tiếng Anh 12 Unit 4 Communication and culture/ CLIL
- Tiếng Anh 12 Unit 4 Looking back
- Tiếng Anh 12 Unit 4 Project
- Tiếng Anh 12 Unit 4 Listening
- Tiếng Anh 12 Unit 4 Speaking
>> Xem thêm
Luyện Bài Tập Trắc nghiệm Tiếng Anh 12 - Global Success - Xem ngay
Group 2K8 ôn Thi ĐGNL & ĐGTD Miễn Phí


Danh sách bình luận